Performance of mobile phone devices: Is there ever any real difference?
- Robert Rehammar, CTO, Bluetest
In April 2019, Bluetest participated in Northern Europe’s largest science festival, the 'Vetenskapsfestivalen', in Gothenburg, co-hosting a special educational event for 8th grade school children, with a focus on microwave technology.
More information about the event itself and pictures can be found here:
- Bluetest joins forces with industry leaders – educational event for children places microwave technology in spotlight
- Bluetest Linkedin feature
- Article from Chalmers University (In Swedish)
Bluetest’s contribution during this special event was to demonstrate how to test wireless performance of mobile phones allowing the young students the opportunity to measure total radiated power from their own phones using Bluetest’s commercial RTS system. In addition to the opportunity to share knowledge, inspire next generation engineers and learn about their thoughts and dreams, we actually had a unique opportunity to do some valuable real-life research. 35 mobile phones of varying brands, age and 'wear and tear' were tested with some very interesting results. This short article will present those results and discuss their implications.

Important metrics for wireless performance
There is a wide range of important metrics used to evaluate the performance of a wireless device. Three of them are Total radiated power (TRP), total isotropic sensitivity (TIS) and throughput (TPUT). Of these, TRP is a transmitter test, investigating how much power the device is capable of delivering. TIS and TPUT are receiver tests used to evaluate at what power level the device can deliver certain bitstream rates. Of these tests, TRP is the easiest and fastest to perform, and thus was chosen for pedagogic reasons.
TRP is measured by placing the device under test (DUT) in the test chamber and connecting it to a base station emulator. The base station emulation tells the DUT to radiate at maximum power and the power is then sampled. In the reverberation chamber, the DUT and mode-stirring plates are moved to vary the electromagnetic boundary conditions. The radiated power is measured many times, followed by an average calculated, representing the TRP of the DUT.
Measurements drawn during the science festival
To keep the measurement time reasonable, 600 samples per device were taken during approximately 1 minute. This corresponds to a standard deviation measurement uncertainty of $$σ = {1 \over \sqrt{600}} ≈ 4.1\%$$ or 0.18 dB.
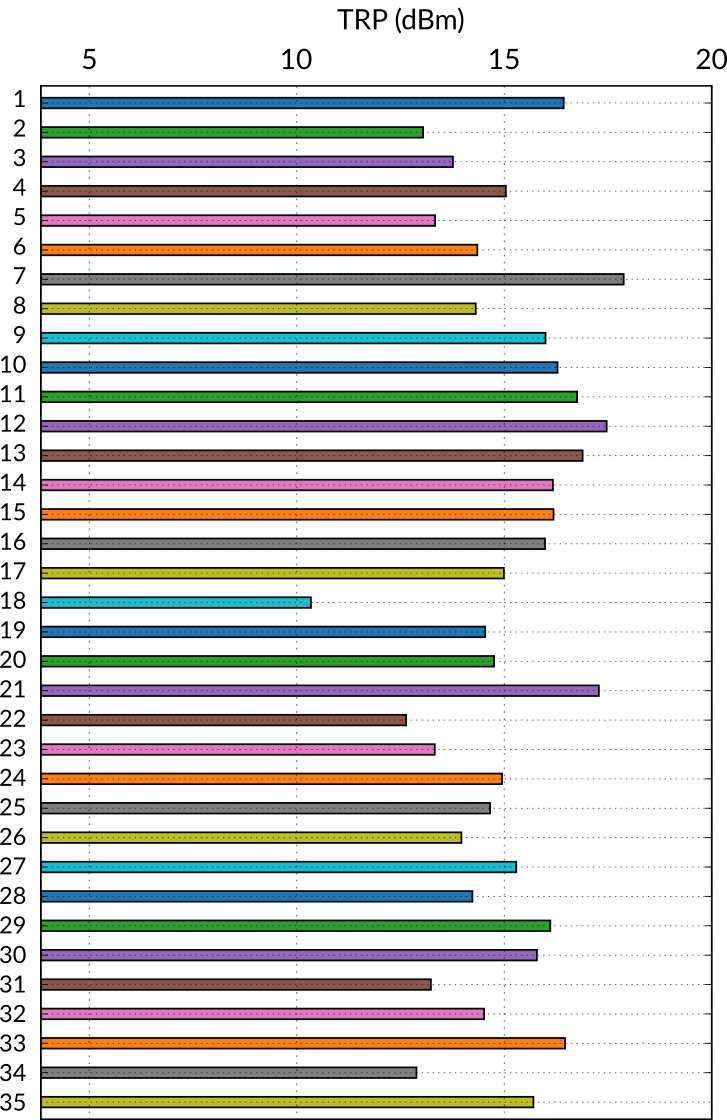
Measurements were taken at LTE band 7, which has its uplink frequency of around 2.5 GHz. (The results from the measurements can be found in the figure below.) What proved to be very interesting was the wide variation that occurred between devices. The tested devices are all commercially available devices that, being in the ownership of 14-15-year-old teenagers, have had varying rough lives. As can be seen, the difference between the top performing and bottom performing device is a staggering 7.6 dB. This is about 5.75 times more output power from the best performing device ($P_{0,7}$, device 7) compared to the worst one ($P_0,18$, device 18). Or, recalculated to cell coverage where the power falls off as $$P_{\mathrm{rec}} \sim {P_{0,i} \over r^2}$$ where $P_0$ is the output power and $P_{\mathrm{rec}}$ is the power at the receiver of the base station. For some given sensitivity level $P_{\mathrm{sens}}$ of the receiver in the base station, the different cell radii possible for the two different devices can be compared by requiring $P_{\mathrm{rec}} (P_{0,7}) = P_{\mathrm{rec}} (P_{0,18}) = P_{\mathrm{sens}}$. This equates to that: $${P_{0,7} \over r_7^2} = {5.75 P_{0,18} \over r_7^2} = {P_{0,18} \over r_{18}^2}$$ or $$r_7 = \sqrt{5.75}r_{18} ≈ 2.4r_{18}$$
That is, to about 2.4 times difference in radius from the cell tower where these two devices can still find coverage. The device with average performance had an output power of 15.3 dBm. Assuming most cellular networks were built with these devices in mind, designing them for the worst performing device would require an increase of the number of base stations with 300 %. On the other hand, if all devices were performing on par with the best in class, the number of base stations could instead be decreased by 35 %. These are huge numbers, if recalculated to money.

Conclusion
This short paper reports how different mobile phones perform in a TRP test at LTE band 7. Among 35 tested devices, a large variation of almost 8 dB was found. Except for the obvious difference in user experience, the implications of this difference for base station deployment was discussed.
About Bluetest
Bluetest AB is the market leader in reverberation test system technology for over-the-air (OTA) testing of wireless equipment and antennas. Bluetest’s technology has been adopted by the largest mobile phone manufacturers, network operators, antenna manufacturers and other providers of wireless solutions. For more information visit bluetest.se/about/ and follow us on LinkedIn.
Bluetest media contacts
Klas Arvidsson
Product Marketing Director
Email: